| 
|
Sub sample 2 - frequent visitors versus other users
In the analysis of the visitor survey, one aim has been to identify the characteristics of the typical Downland user. This approach is now explored further in an attempt to develop a picture of the Downland enthusiast - the frequent user.
To effect this, the overall sample has been divided into two user sub-groups, 1) those who use the Downland once a month or more and 2) those using the Downs less than once a month or who have never used the Downs before. These are termed as "frequent" and "other" users. Of the total 4890 valid cases for analysis, 48 percent were frequent users and 52 percent other users.
Although 64 percent of other users were on a day trip, the frequent user is much more likely to be day tripping. Ninety three percent of frequent users were day tripping and a similar figure was recorded for those coming from home. Using Chi-Square, there is a significant relationship between those on a day trip and the frequent user. Furthermore the frequent user is more likely to come from an inland location and to be on his/her own than the other user. In spite of this the likelihood is that the frequent user will be in a family or couple group (66%). There was a significant tendency for the frequent user to be male although females still accounted for 41 percent. This may well be due to personal safety considerations encouraging women to visit less frequently or in groups.
Most frequent users come from Sussex and are therefore locals. Only 27 percent of frequent users came from elsewhere compared with 76 percent of other users. This aspect is reflected in the distance travelled data.
Compared with the West Sussex "all county" data, Standeven notes that the Downland shows a higher incidence of frequent user and a lower incidence of first time visitors.[17]
When asked how they travelled, there were only minor variations between the two user sub-groups. Only a minimal percentage of the total frequent users were more inclined to use mountain bikes or to be walking than other users. This was further reflected in the percentages, albeit small, of frequent users participating in on and off road cycling. However use of car remained the principal method of travel at over 80 percent for both user groups.
As would be expected, a high number of frequent users claimed to have always known the Downland (75 percent) whereas other users were more dependant on other information systems, such as word of mouth and leaflets, for local knowledge. Only 44 percent claimed to have always known about the Downland, which is still nearly half the sub sample.
In accordance with the figures discussed under the earlier day/overnight visitor sub sample analysis, other visitors, with the greater emphasis on overnight tourists than the frequent users, were more likely to visit the formal locations such as Ancient Monuments, Museums/Historic Homes, Downland Villages and Souvenir Shops. The frequent visitor was more inclined to use footpaths and bridleways but less inclined to use car parks, presumably because they were aware of informal places to park.
A significant number (19 percent) of the frequent visitors exercised their dogs and this is clearly a major use of Downland sites by locals. This does not however lead to an inclination to walk more than was recorded for the total sample.
Finally, frequent users had a much higher expectation of having to pay nothing for all aspects of expenditure researched. Standeven suggests that expenditure anomalies may be due to an economically divided society[18] although the sub-sample analysis shows little variation in the occupation/job breakdown between the two sub-samples. The conclusion is that frequent, and therefore largely local, users have an expectation of using the Downland without cost.
The picture that emerges is of frequent, substantial use of the Downland by the local populace for informal recreation. This is matched by a similarly large group of other users who view the Downs as a facility for recreation but who are prepared to go to greater lengths and cost to enjoy the benefits.
VOLUME AND VALUE ANALYSIS
OF RECREATIONAL TOURISM ON THE DOWNLAND.
From the Downland Visitor Survey it is known that 47 percent of visitors come from Sussex and that 80 percent travel less than 50 miles to visit the Downs; in fact 33.9 percent travel less than 10 miles. It is therefore apparent that any Downland visitor number estimates need to include recreation by local residents, if the broad definition of Downland recreational tourism debated in Chapter 4 is to apply and a realistic evaluation of impact is to be achieved. To this end, further working of the University of Newcastle MAFF ESA research described in Chapter 5 (8) provides valuable new insights into numbers and worth based on resident population, visitor population and non user values.[20]
Resident population Willis et al (the Newcastle MAFF/ESA research) estimate the resident population of the ESA to be 13,641 households, based on the parish data from the Office of Population Censuses and Survey's decennial 1991 census. This figure is an approximation due to parish boundaries extending beyond the ESA but nevertheless provides a useable estimate of population density in a Downland landscape. The ESA approximates to 68,000 ha whereas the core study area approximates to 76,300 ha, there being boundary variations discussed in chapters 2 and 3. Proportionately adjusting, the estimated households become 15,306 for the Sussex Downs core study area.
Endorsement for this estimate of population density comes from data published by the Sussex Rural Community Council who estimate a resident population of 16,307 households (40,718 persons over 16) for the AONB, again using the census data.[21] The source of data being parish based, would include in both instances, communities such as Midhurst but would exclude in the Willis data, villages such as Fernhurst and part of Haslemere which are some distance from the Downland. The figure of 15,306 households would appear to provide a reasonable working estimate of the population of the core study area, given the inaccuracies inherent in using the parish census data as a source and the limited use to which these figures will be applied in this thesis.
Using the rule of thumb of 2.4 persons per household, the household estimates suggest a resident population in the core study area of about:
15,306 x 2.4 = 36,734 persons.
Visitor population Visitor numbers are exceedingly difficult to calculate with confidence over an extended area. Chapter 4 identifies specific attraction numbers but most of these locations are outside the core study area. Willis et al have calculated the propensity to visit the ESA based on a random survey of catchment zones throughout the UK. From their survey it is estimated that 3,062,000 households visit the Downland ESA each year.[22] Willis argues that this is likely to be an overestimate due to difficulty in determining boundaries of the ESA by respondents, too wide interpretation of what is a purposeful visit and response errors resulting from memory and prestige bias. Willis gives an adjusted lower estimate of households visiting of 2,580,117. In the same research Willis compares this with a figure of 1,304,471 for the Somerset Levels and Moors.
If it is assumed that ESA/Downland visitor frequency is similar per hectare, it is possible to calculate visitor households according to the Willis perception of what determines a visit, a point which Willis notes is debatable. Adjusting for hectareage this gives a figure of households visiting the core study area.
2,580,117 x 76,300 = 2,895,051
68,000
The difficulty comes in converting this estimate to numbers of people. Willis considers it erroneous to multiply households by 2.4 as a "rule of thumb" estimate of persons per household, as this element was not considered in the context of the MAFF/ESA survey.[23] From the Willis data it is known that at least one person from each household visits the Downland in each year but there is no available evidence from Willis to suggest that all persons in the household visit in one year. In order to gain an approximation of visitor numbers therefore it is necessary to make an assumption. The assumption is that in visiting households, a spectrum of numbers visiting will range from 1 in some households to all in others. As the average number of persons per household is 2.4 then the range is 1-2.4, the mean of which is 1.7.
From the above it is possible to make an approximation of the number of persons who visit the core study region in a year, based on developing the Willis data:-
2,895,051 x 1.7 = 4,921,587
Allowing for the long term growth in outdoor recreation since Willis conducted his survey in 1992/3, it can be concluded that about 5 million people visit the core study region each year using the Willis perception of a tourist. However, using the methodology described in the following arguments, which suggest that the Willis visitor numbers are 75.8 percent of the real total, the number of people who visit the core study area, based on the broader definition of tourism used in this thesis, is 6,492,859. This compares with the CPRE figure of 10 millions for the South Downs overall.
The number of people who visit the Downland however is not the full picture. Willis estimates that each person in his sample, on average, visits the Downland at least 5 times per year.[24] From this it is possible to estimate the number of Downland visits based on Willis in a year as at least
4,921,587 x 5 = 24,607,935.
Allowing for the long term growth in outdoor recreation, it can be concluded that about 25 million visits are made to the Downland each year by visitors as identified by Willis.
This figure however is subject to the following qualifications. First, that the assumptions above are acceptable. Second, that the figure of 5 visits per annum is relevant. The Downland Visitor Survey carried out for this thesis suggests that the average visits per person per annum is 22.59.[25] The MAFF and Downland Visitor Surveys were each based on a different sampling methodology. The Visitor Survey was on-site, unlike the MAFF/ESA research and this would have created a bias. The Visitor Survey included the large numbers of local casual users identified earlier and in Chapter 4 as being within the broad definition of tourism for the purpose of this thesis, the data from the two surveys is therefore not directly compatible without adjustment.
Is it possible to use the development of the Willis data to provide an estimate of true Downland visitor impacts based on the much broader definition of tourism debated in Chapter 4? Such an estimate would need to accommodate the local casual use of the Downland not apparent in the Willis data. Willis also excluded visitors originating from outside the UK.
From the regional analysis of the Willis ESA visitor sample, 69.85 percent of visitors originate from the UK other than the south east counties.[26] From the Downland Visitor Survey it is known that there were 2537 respondents from other than the south east counties out of a valid, useable response of 4791 (ie 52.96 percent). Willis would have expected the 2537 to be 69.85 percent of the total responses for the Downland Survey, had the Downland Visitor Survey been limited to visitors as identified by Willis. From this it is possible to calculate a theoretical total sample size, based on Willis, of 100 percent, ie 3632. By subtracting this figure from the actual sample size of the Downland Visitor Survey, it is possible to calculate the degree of local usage and foreign origin visitors to the Downland not identified in the Willis research as
4791 - 3632 = 1159
(100%) - (75.8%) = (24.2%)
ie. 24 percent.
It is known from the Downland Visitor Survey that foreign visitors amount to 6 percent of the total. It can be concluded therefore that local casual use of the Downland, not identified by Willis, amounts to about 18 percent of the total.
Earlier it was calculated that, using the Willis perception of visitors, there are 24,607,935 visits to the core study area in a year. This would exclude the extensive casual local use and foreigners and it is now possible to adjust this estimate for the broader use of the Downland applying in this thesis. We know from the above calculation that the visitors excluded by Willis account for 24.2 percent of the total, in other words Willis identifies 75.8 percent of all visitors. An estimate of total visitors on the Downland in a year can therefore be arrived at as follows:
24,607,935 x 100 = 32,464,294
75.80
ie. 32.5 Millions - 3.25 x 10 to the power of 7.
Whist many of the assumptions made to arrive at this figure are tenuous, it does provide a considered estimate and insight into visitor impacts in the Sussex Downland for the first time to the author's knowledge. In order to test the hypothesis, the visitors to the Sussex Downs are considered in the light of national data on visits to the countryside.
The Countryside Commission estimate that there were 1,600 million trips to the countryside in 1990 in England and Wales.[27] This figure has subsequently been qualified by the Day Visits Survey which estimates 900 million visits but excludes under 15 year olds.[28] Using the Countryside Commission data, the 32.5 million visits to the Sussex Downs represents 2.0 percent of the total based on the Chapter 4 definition of Downland tourism. The land area of England and Wales amounts to approximately 140,110 sq km.[29] Rural land accounts for 85 percent of the total in England.[30] Assuming a similar proportion of rural land in Wales, it can be calculated that the area of rural land or countryside in England and Wales is about
140,110 x 85 x100 = 11,909,350 hectares.
100
The core study area amounts to 76,300 ha and therefore represents 0.64 percent of the total countryside of England and Wales, yet in spite of this it hosts 2.0 percent of all countryside visits. Willis notes that the South Downs has the highest number of visits per respondent of any ESA and this, coupled with the high percentage of respondents who had visited the South Downs at all, indicates that it is the most highly visited ESA in England.[31] The dangers of juxtapositioning data from different research programmes are well recognised and subsequent studies will doubtless be able to refine these estimates further. This is the first known assessment of visits to the core study area and particularly underlines the importance of the Downland as a recreational resource.
Non user values Having discussed the resident population and visitors, Willis identifies a third category of persons to whom the Downland has a value, albeit not as a result of direct use. This group particularly includes individuals who seek the landscape values and wildlife conservation implications without necessarily directly experiencing the Downland first hand.
Economic worth of the Downland Willis et al use the three categories of beneficiary, residents, visitors and non-user values data to calculate an economic value of the Downland ESA using a willingness to pay tax quotient calculated from the research returns. Willingness to pay techniques are now being used successfully to research a value for facilities provided from the public purse.[32] These estimates provide a valuable indication of the overall utility of the Downland ESA measured in �s. (see table 6:6)
Table 6:6 ECONOMIC WORTH OF THE DOWNLAND
Visitors 48,408,000
sub total 48,682.000
Non users 31,153,000
total 79,835,000
The UK Pounds 80 millions identified in Table 6:6 as the worth of the Downland compares with UK Pounds 52,637,000 for the Somerset Levels and Moors.
Willis notes a number of limitations to the above calculation including the difficulty in determining precise visitor numbers. For calculating the financial figures, the downward adjusted household numbers were used. It should also be noted that Willis does not include overseas visitors in his calculation of worth.
The methodology used by Willis renders it impossible to adjust the ESA worth figures to the larger core study area. This results from a segregation of landscape preference, ie intensive agriculture versus ESA. The comparable split for core study region visitors is not known, and to estimate provides a further dimension of unnecessary uncertainty.
Due to the similarity of the Downland ESA to the Sussex Downs core study area and the difficulties in the Willis respondents from distinguishing between the two, a figure in the region of UK Pounds 80 millions would appear to be a reasonable public valuation of the Downland region in general. Local residents account for only a small part of that figure in spite of the substantial use identified earlier in this chapter. The Willis estimates of worth are understated in this respect therefore. Non users contribute approximately 40 percent of the total, which illustrates the extent to which support can be forthcoming for a "below the horizon" worthwhile cause.
Willis compares the �80m economic valuation with the costs of the ESA landscape which are identified as follows:
ESA payments to farmers: UK Pounds 4.32m
Public exchequer costs adjusted for EC contributions: UK Pounds 1.94m
Arguably not all of the costs involved in sustaining the Downland as a special place are reflected by Willis. These figures are therefore considered further in later chapters as part of the evaluation of costs and worth of the Downland visitor landscape.
In conclusion, it can be seen that the public valuation of the Downland far exceeds those estimated costs identified by Willis et al. In addition the extrapolation of visitor numbers of the core study area suggests a resource of far greater recreational value than previous estimates suggest. The implications of this data are considered further in the ensuing chapters.
Footnotes:
[1] Sussex Downs Conservation Board, 1994, Annual Report 1993/4, p5 and p20.
[2] Dr J Standeven and team, University of Brighton and former research contractor of ESCC; Dr K Willis*, University of Newcastle and research contractor for MAFF ESA Visitor Survey. Dr B Short, University of Sussex representing University and SDCB interests; Bob Connell pursuing WSCC planned update of the 1986 Visitor Study, Brian Harrison pursuing the ESCC Heritage Coast planned research; Mark Dowling of SEETB, W Toome*, Brighton Borough Council Tourism Officer, Bruce E Osborne author; Julian Grey who later represented the SDCB;
* Absent member or declined involvement.
[3] See Chapter 8.
[4] See Chapter 4.
[5] 1) Standeven J. Clarke R. Larner S. 1994, Sussex Downland Visitor Survey, report prepared in conjunction with the University of Sussex for the SDCB, Leisure Research Unit, University of Brighton.
2) Standeven J. Clarke R. Larner S. 1994, West Sussex Visitor Survey, report for the WSCC, Leisure Research Unit, University of Brighton.
[6] Osborne B. 1995, Sussex Downland Visitor Survey - Principal Findings, SDCB. public relations leaflet.
[7] See Chapter Five, "Day Trippers versus Overnight Tourists".
[8] Standeven J et al. 1994, Sussex Downland Visitor Survey.
[9] Standeven J et al. 1994, Sussex Downland Visitor Survey.
[10] See table 5:9.
[11] See Chapter 5 (4).
[12] See Chapter 5.
[13] Standeven J. at al. 1994, West Sussex Visitor Survey.
[14] See Chapter 5, (7).
[15] See Ch. 5, points made relating to fig. 5/1.
[16] Standeven J. at al. 1994, West Sussex Visitor Survey.
[17] Standeven J. at al. 1994, West Sussex Visitor Survey.
[18] Standeven J. at al. 1994, West Sussex Visitor Survey.
[19] CPRE, 1990, What Future the South Downs? promotional leaflet.
[20] Willis K G, Garrod G D, Saunders C M. 1993, Valuation of the South Downs and Somerset Levels and Moors ESA Landscapes by the General Public, University of Newcastle, Centre for Rural Economy, Nov. Executive Summary and main Report, chapter eight.
[21] Cherrett T.(Sussex Rural Community Council) et al, 1994, Rural Community Needs, a report prepared by the SDCB Rural Development Panel, Jan. see tables 3a and 4a etc.
[22] Willis K G, et al. 1993. Report, Chapter eight. See table 8:4.
[23] Willis K G. 1994, correspondence with the author, 7 Feb. para 1.
[24] Willis K G. 1994, correspondence with the author, 7 Feb. para 2.
[25] Based on q.17 responses, using the median for each category, multiplying by the frequency and then taking the mean of the grand total.
[26] Willis K G, et al. 1993. Report, chapter eight, table 8.4, calculated by subtracting percentage of visitors from the south region from 100 percent. The approximate compatibility of the south region with the south east counties of the Visitor Survey was determined in correspondence with Willis 19.4.94 and by reference to Appendix 4.8 of the Willis report, ESA General Public Survey Interview Sites.
[27] Countryside Commission, 1992, Enjoying the Countryside, Policies for People, CCP 371, p 10.
[28] Countryside Recreation Network News, 1994, 1993 UK Day Visits Survey, Survey Research Associates for Countryside Commission, Countryside Council for Wales, Scottish Natural Heritage, Scottish and Wales Tourist Boards, Forestry Commission, British Waterways and Dept. National Heritage. Dept. City and Regional Planning, University of Wales, Volume 2, Number 1, Feb, page 8.
[29] Countryside Commission, 1992, Protected Landscapes in the UK. CCP 362, p5; areas of National Parks, taken as 10 percent of total land area as generally published.
[30] Sinclair G. 1992, The Lost Land - Land Use Change in England 1945-1990, CPRE, see table/appendix 17.
[31] Willis K G, et al. 1993. Report, Table 5.18.
[32] Tranter R B, Bennett R M, Beard N F. 1994, Valuing Woodland Walks, University of Reading, reported in Countryside Recreational Network News, Vol 2 No 2, June.
[33] Willis K G, et al. 1993. Executive Summary, page 9.
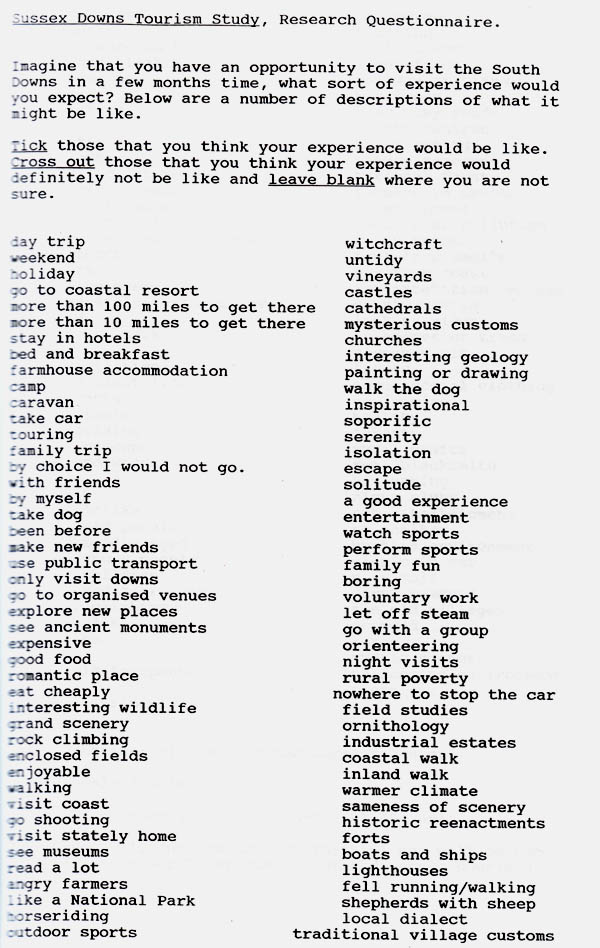
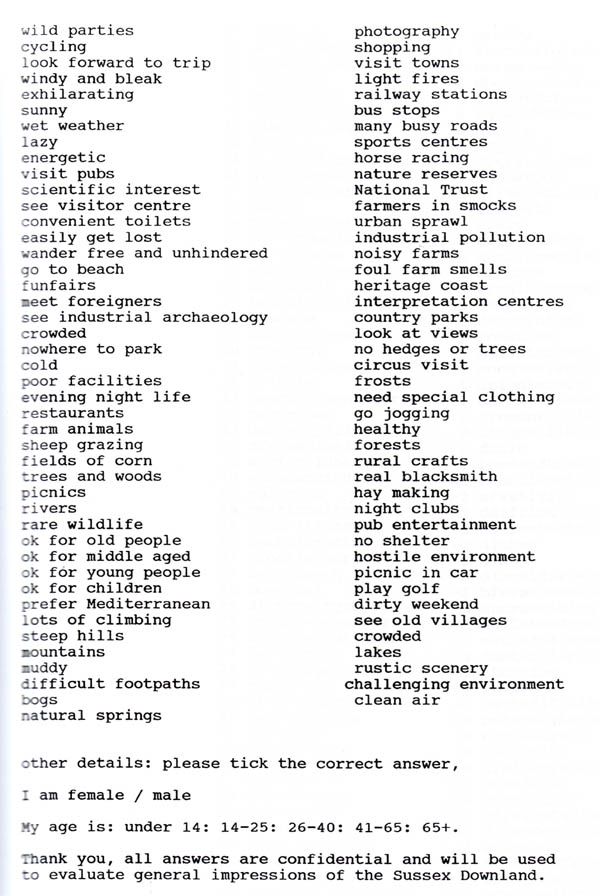
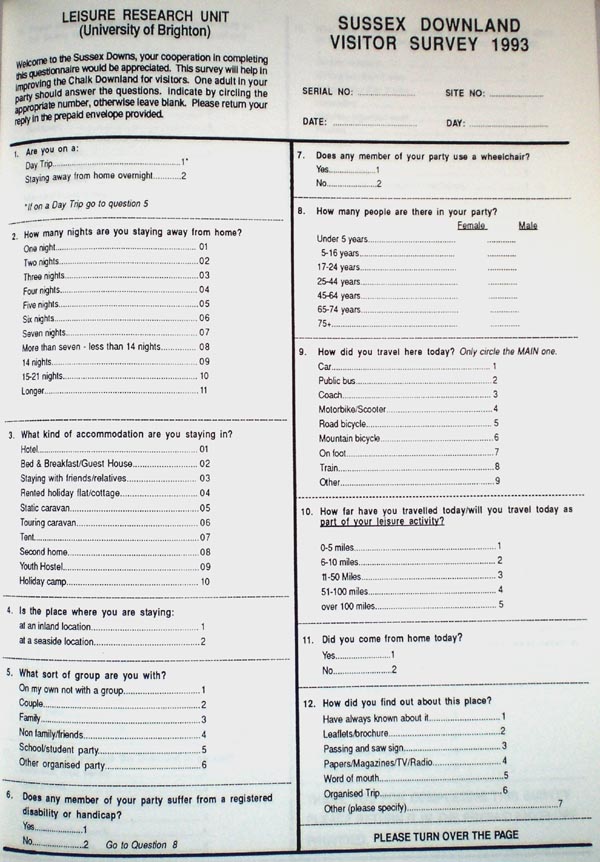
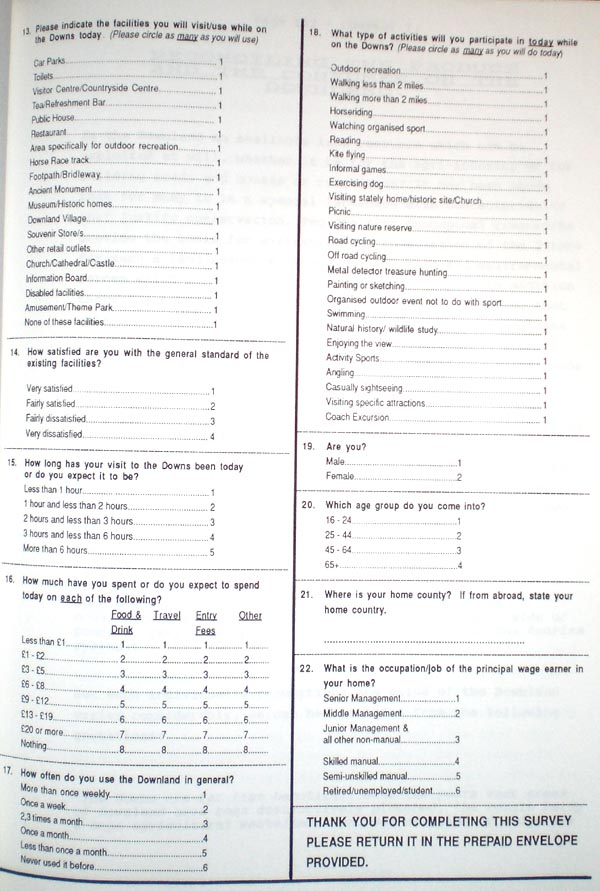
2. Downland Visitor Survey Questionnaire